Step-by-step guide
WPI to PD rating: how an impairment percentage becomes a PD rating
A doctor writes a whole person impairment (WPI) percentage. California then runs that number through the permanent disability rating schedule and produces a PD rating — the permanent partial disability (PPD) rating most claims with residual impairment are rated under — along with a number of weeks and a weekly benefit. This walkthrough follows a California rating string / PD calculator on screen, step by step, so you can see where each number comes from.
The short answer
- A report gives whole person impairment (WPI) percentages under the AMA Guides. That WPI is an input to the rating, not your PD rating.
- California converts each WPI into a rating string: impairment number, WPI, DFEC adjustment, occupational variant and age adjustment, ending in a PD percentage for that body part.
- Occupation, age at injury, date of injury, pain add-ons and apportionment all move the result, so two workers with the same WPI can rate out differently.
- The final PD percentage becomes total weeks of PD and a weekly PD rate — capped by statutory minimum and maximum earnings — which together produce the total PD payout.
- High ratings also generate a life pension rate. Treat anything on a calculator screen as an estimate until the DEU or the claims administrator issues the official rating.
Source video
Rating String/Permanent Disability Calculator
Sullivan on Comp
Screenshots come from the Sullivan on Comp rating string / PD calculator demo above; the written steps are ours and follow what the video shows on screen. The rating-string structure and payout rules were checked against the DWC Disability Evaluation Unit and the 2005 permanent disability rating schedule. The 7% WPI → 9% PD worked example used in the FAQ is from “What is my QME report worth? How does WPI turn into PD?” by My Workers’ Comp Guide (youtube.com/watch?v=blichehVwqw). Official source: www.dir.ca.gov/dwc/DEU.html
From WPI to a PD number, screen by screen
Every screenshot below is a real step in a California permanent disability rating, and each one links to the exact second in the source video. The numbers are from the demo claim — yours will differ.
- 1
Open the rating string / PD calculator
Start on the calculator page and read the description at the top: it explains what the tool does and which assumptions went into it, which is worth doing the first time you use it. The report fields above the line — matter number, doctor, report date, injured worker name — are optional and exist so you can print a clean report.
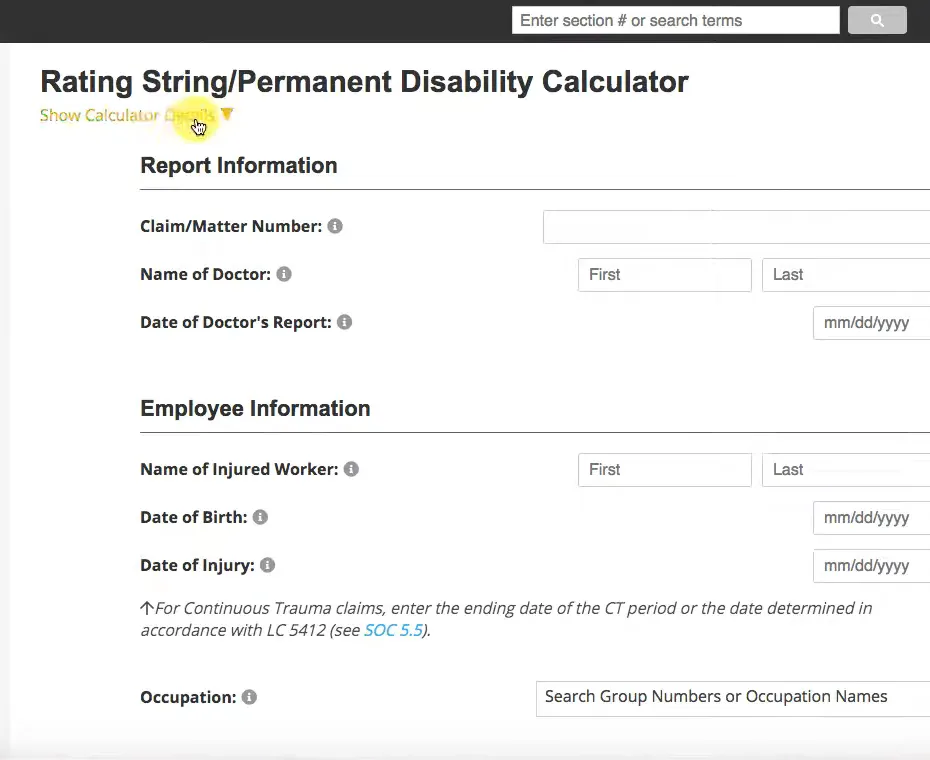
The top fields only dress up the printed report — they do not change the math.Watch at 0:10 - 2
Enter date of birth and date of injury — they pick the schedule
The calculator runs either the 2005 or the 2013 permanent disability schedule and prints a message based on the date of injury telling you which one it is using. In the demo a 02/17/2016 injury runs on the 2013 schedule. Date of birth matters just as much, because the age at injury drives the age adjustment further down the rating string.
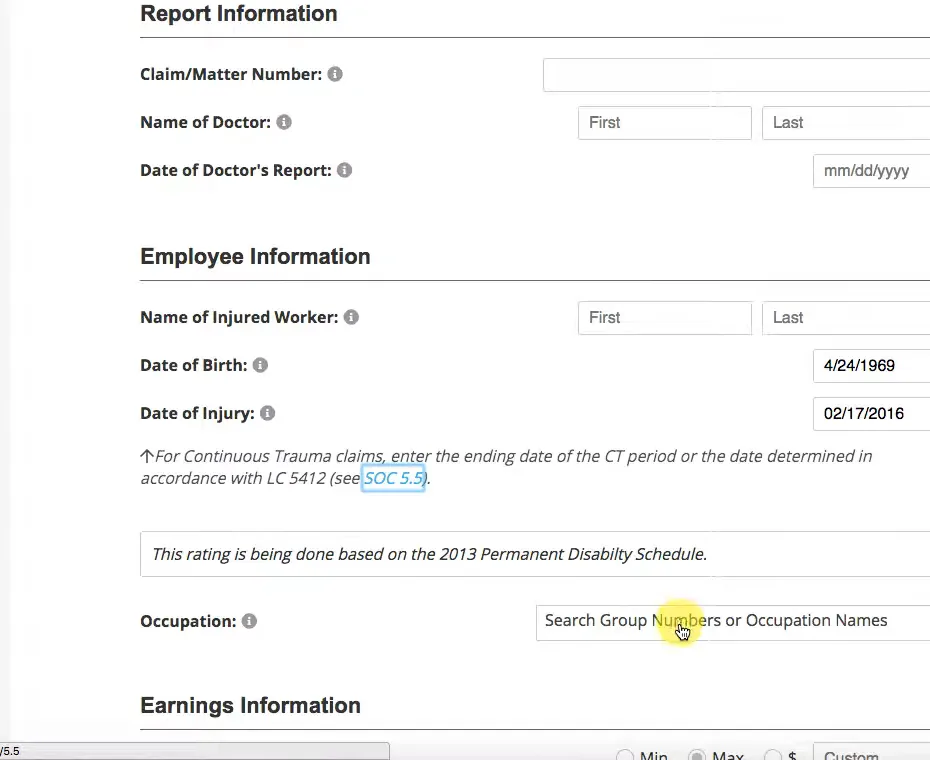
Same impairment, different injury date, different schedule.Watch at 1:45 - 3
Set the occupation group number
Type a job title or a group number into the Occupation field and pick the closest match; the demo uses LABORER, GENERAL - steel & rel. (Group 460). There is no free-form entry — the schedule rates an occupation by group, and that group number later shows up in the middle of the rating string.
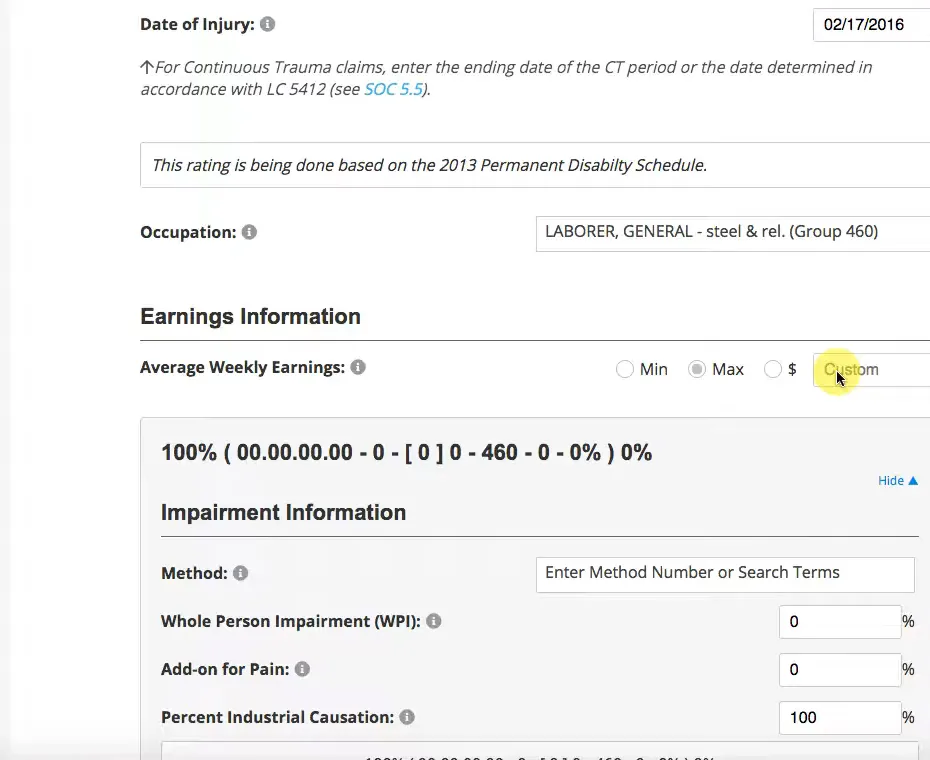
The group number is not paperwork — it is a variable in the rating.Watch at 2:00 - 4
Enter average weekly earnings
Enter the calculated average weekly earnings, or press Max if you already know the worker is above the state maximum. The tool identifies whether your figure falls under the statutory minimum or over the maximum, and the earnings number is what the weekly PD rate is eventually built from.
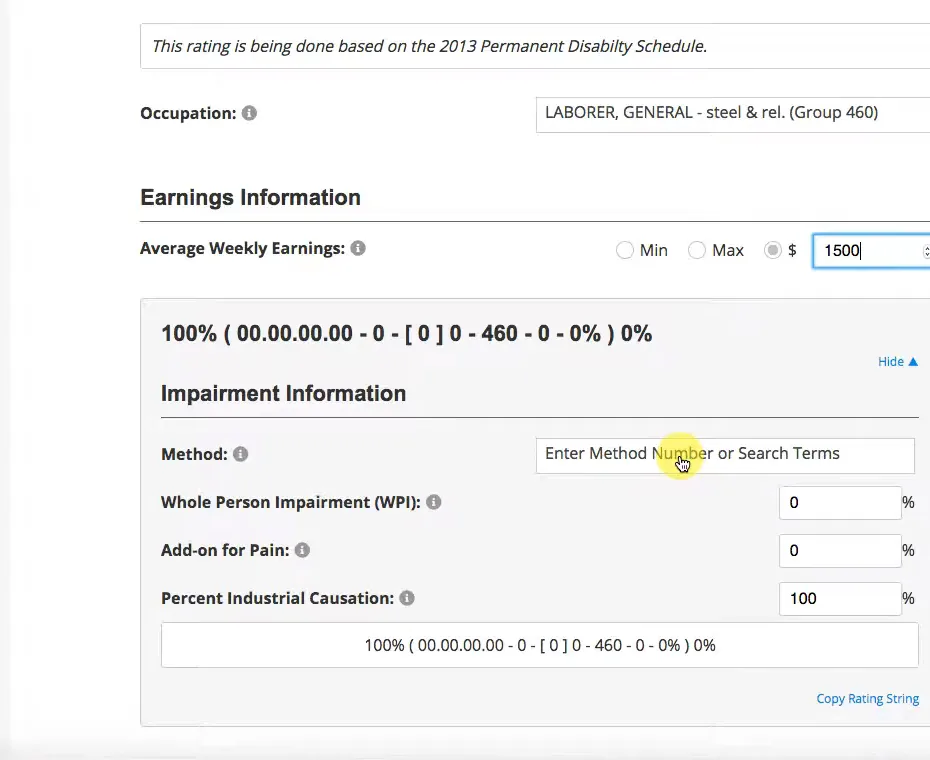
Earnings do not move the percentage; they move what each week pays.Watch at 2:13 - 5
Pick the impairment method number for each body part
The Method field is a searchable list of impairment numbers from the schedule — the drop-down in the demo lists entries such as 03.01.00.00 for cardiovascular conditions. The number you choose decides which chapter, method and adjustment tables the WPI will be run through, so it is worth checking against the body part named in the doctor report.
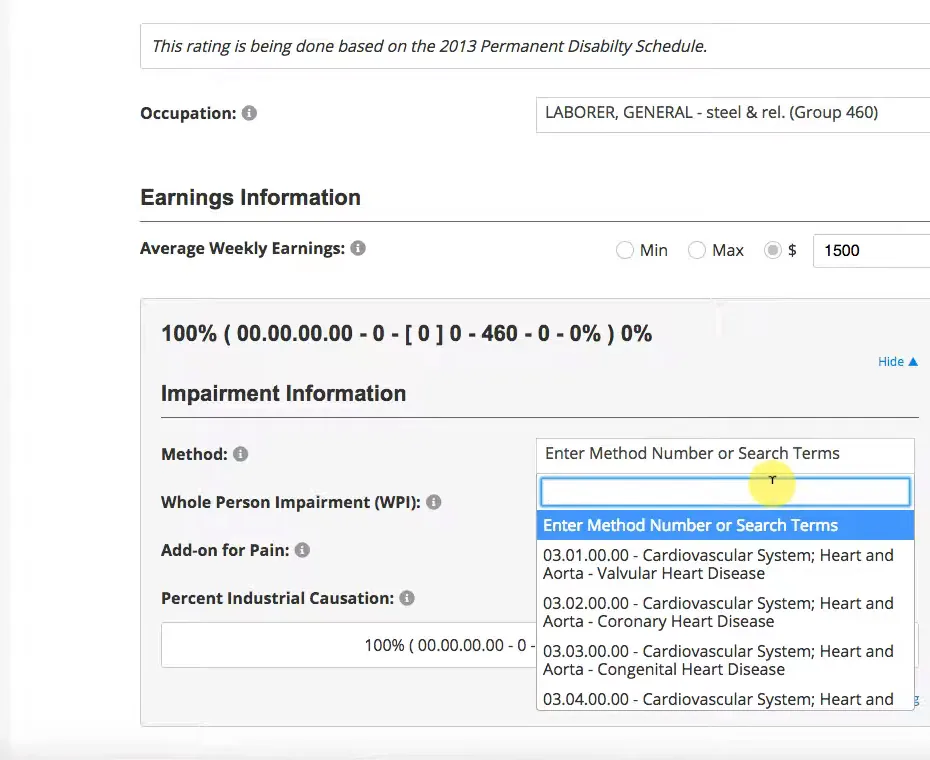
The code you pick here selects the tables the WPI is run through.Watch at 2:16 - 6
Choose the side and body part
For upper and lower extremity impairments you have to say which side; the drop-down offers Left, Right and NA or Unknown. The choice is not cosmetic — it carries through to the impairment number and to the way the individual ratings are combined at the end.
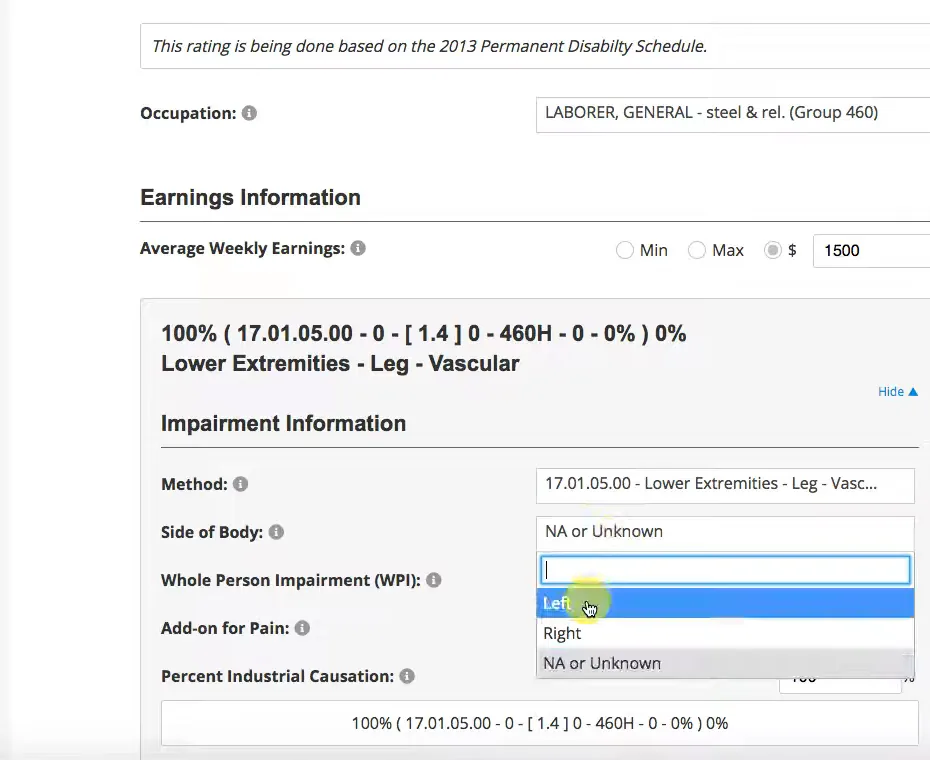
Left, right or not applicable — the rating cannot be finished without it.Watch at 2:20 - 7
Type the WPI percentage and the doctor’s pain add-on
The Whole Person Impairment (WPI) box is where the AMA Guides percentage from the report goes. If the report allows an add-on for pain, it belongs in the Add-on for Pain box: in the demo a 1% add-on lifts the WPI figure inside the string from 18 to 19, before any DFEC, occupational or age adjustment. The schedule caps the pain add-on at 3% WPI.
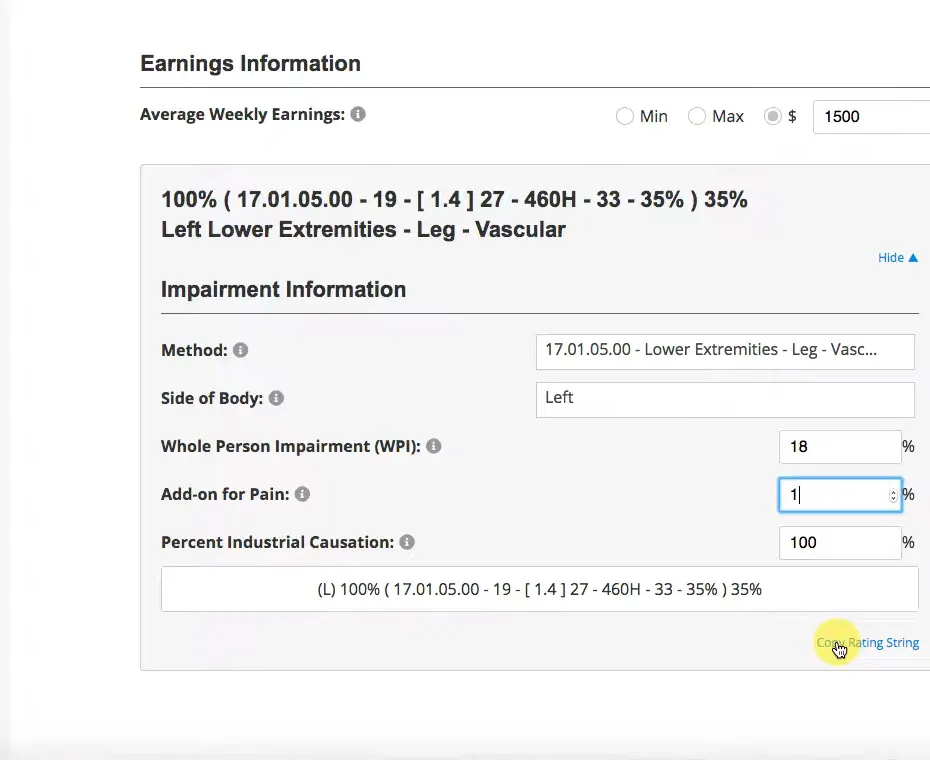
18 plus a 1% pain add-on becomes 19 in the string — not in the final rating.Watch at 2:38 - 8
Add every body part — each keeps its own rating string
Press Add Another Impairment for each injured part instead of guessing at one combined number. Every entry keeps its own string with its own body-part code and its own WPI value, and you can copy a string to paste into a report. You can edit or remove impairments later, but the first one always has to stay.
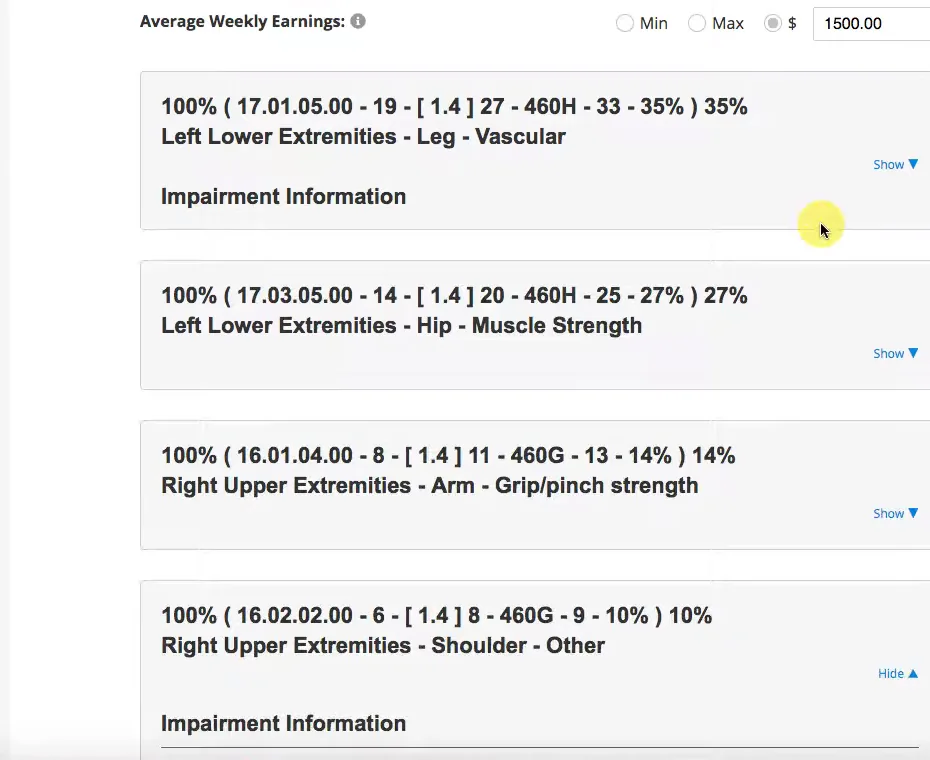
Four body parts, four strings — they get combined later, not now.Watch at 3:20 - 9
Press Calculate Results to see the combining order
Nothing is combined until you press Calculate Results. The tool then shows the order the schedule requires — extremity values are merged first — and the arithmetic behind each step, for example 35 C 27 = 53 and then 53 C 23 C 23 = 72. Combined values use the schedule’s combination formula, so two 30% ratings do not make 60%.
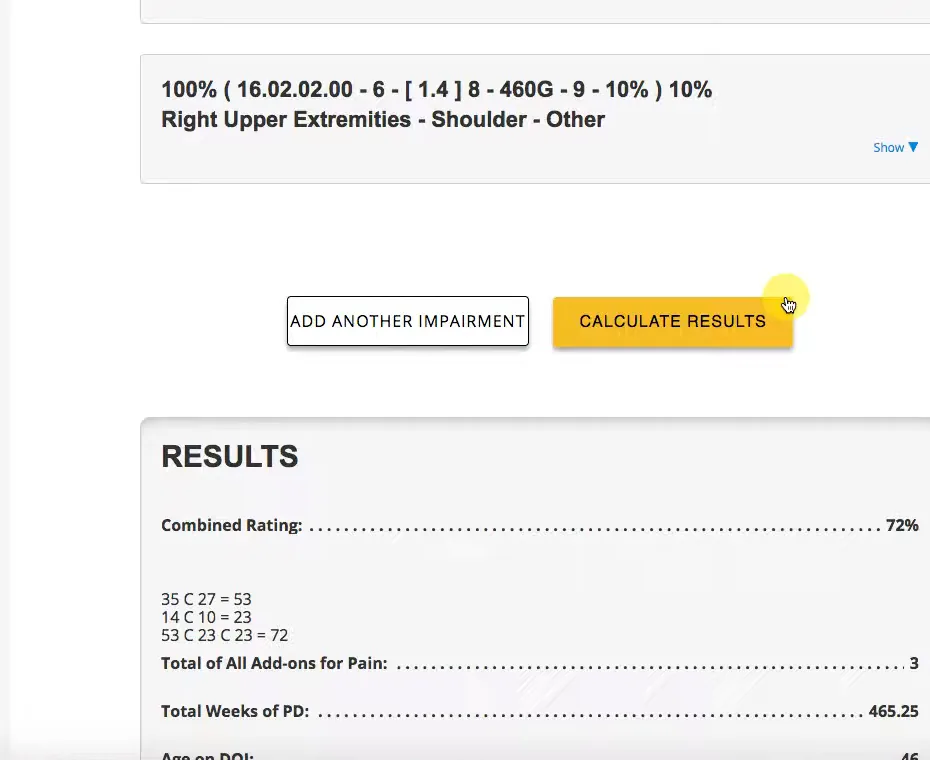
The combined value is smaller than the sum — that is the point of the formula.Watch at 4:20 - 10
Read the payout block: weeks, weekly rate, total PD
The results panel turns the percentage into money: combined rating, total add-ons for pain, total weeks of PD, age on the date of injury, average weekly earnings (flagged with “Statutory Max” when the cap is applied), the weekly PD compensation rate and the total PD payout. It also flags whether return-to-work adjustments apply and adds a life pension weekly rate at the higher ratings, with a link to a present-value calculator.
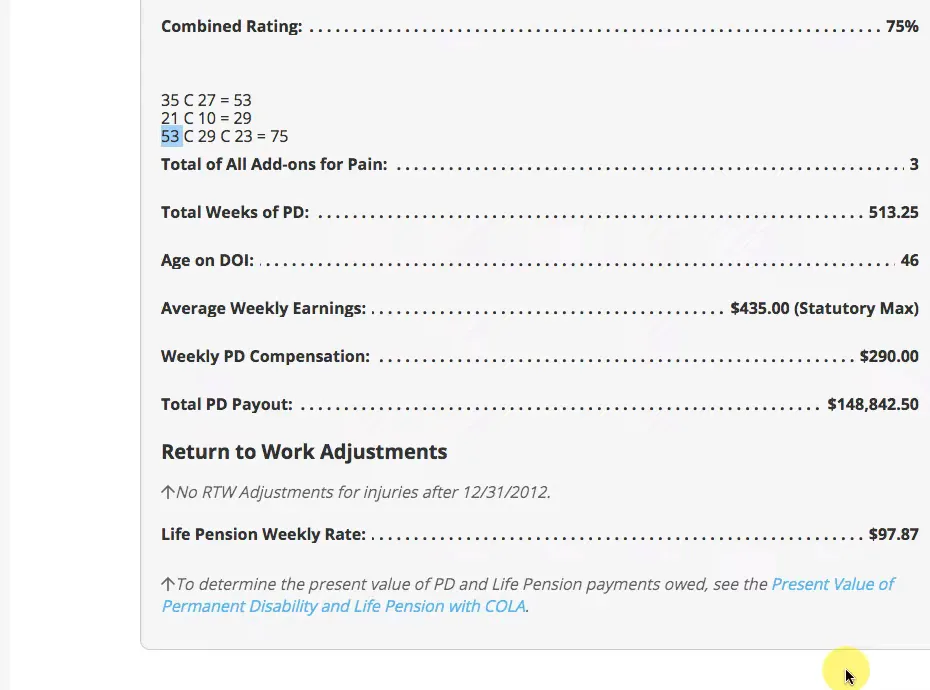
75% PD, 513.25 weeks, $290 a week — the percentage finally becomes a number.Watch at 6:40
FAQ
- Is my WPI percentage the same as my PD rating?
- No. The doctor rates impairment under the AMA Guides (that is the WPI); the PD rating is calculated from it using the body part, the occupational group, the age at injury, the date of injury and any apportionment. In one video walkthrough, a 7% shoulder WPI for a 30-year-old rated out to 9% PD for a musician — an older worker or a heavier occupation would have moved that number.
- What do the numbers inside a rating string mean?
- Read it left to right: the impairment number for the body part, the WPI percentage, the DFEC adjustment (the 2013 schedule applies a 1.4 factor, written as [1.4]), the occupational group and variant, and then the occupation- and age-adjusted value that ends as the PD percentage for that part. Older injuries run on the 2005 schedule, which uses DFEC modifier tables instead of the flat 1.4 factor — that is why a string is not just a percentage.
- Why can two people with the same WPI get different PD ratings?
- Because the schedule adjusts the WPI for occupation, age and date of injury, then applies apportionment and any allowed pain add-on. A shoulder impairment hits a ditch digger differently than a desk worker, and an older worker rates higher than a younger one. A rating made for someone else’s claim tells you very little about yours.
- How is the weekly PD payment set?
- The percentage produces a number of weeks, and those weeks are paid at a weekly rate that depends on the earnings used for the claim and on the statutory minimum and maximum in effect for the injury year — the demo shows the calculator flagging that the statutory maximum was applied. Life pension rates can apply at higher ratings. Rates change by injury year, so an old dollar figure is not a promise.
- Where does apportionment come in?
- It appears as the “Percent Industrial Causation” field in the calculator. If the medical record says part of the impairment comes from an earlier injury, a prior condition or a later event, apportionment reduces the percentage attributed to this claim. Whether apportionment applies, and how much, depends on the individual case and the reporting — it is not something a calculator can decide for you.
- Can this page tell me what my case is worth?
- No. A rating sets a PD percentage and a weekly PD benefit; a settlement also turns on future medical care, temporary disability already paid, apportionment and whether the parties compromise disputed issues. Use the numbers here to understand the mechanics, then confirm the official rating with the DWC Disability Evaluation Unit or the claims administrator.
Keep reading
Educational information only, not legal advice. Every rating depends on the individual medical record, the injury date and the official schedule; calculators and screenshots here are illustrations, not a valuation of your claim.